R入門
Rによる計量統計学(オーム社)
最終更新:
r-intro
-
view
目次
定数項ダミー(pp.235-237)
データをテキストファイルk0901.csvに保存。
i,  x,  y, d
 1,  1,  2, 0
 2,  2,  5, 1
 3,  3,  7, 1
 4,  4,  3, 0
 5,  5,  7, 1
 6,  6,  5, 0
 7,  7,  9, 1
 8,  8,  5, 0
 9,  9,  7, 0
10, 10, 10, 1
> dtf <- read.csv("k0901.csv", header = TRUE)
> r1 <- lm(y ~ x, data = dtf)
> r2 <- lm(y ~ x + d, data = dtf)
> summary(r1)
Call:
lm(formula = y ~ x, data = dtf)
Residuals:
Min 1Q Median 3Q Max
-2.394 -1.438 0.000 1.438 2.394
Coefficients:
Estimate Std. Error t value Pr(>|t|)
(Intercept) 2.9333 1.3306 2.205 0.0586 .
x 0.5576 0.2144 2.600 0.0316 *
---
Signif. codes: 0 ‘***’ 0.001 ‘**’ 0.01 ‘*’ 0.05 ‘.’ 0.1 ‘ ’ 1
Residual standard error: 1.948 on 8 degrees of freedom
Multiple R-squared: 0.458, Adjusted R-squared: 0.3903
F-statistic: 6.76 on 1 and 8 DF, p-value: 0.03161
> summary(r2)
Call:
lm(formula = y ~ x + d, data = dtf)
Residuals:
Min 1Q Median 3Q Max
-0.7864 -0.4490 0.0000 0.4490 0.7864
Coefficients:
Estimate Std. Error t value Pr(>|t|)
(Intercept) 1.16505 0.49068 2.374 0.0493 *
x 0.57767 0.07094 8.143 8.14e-05 ***
d 3.31553 0.40753 8.136 8.19e-05 ***
---
Signif. codes: 0 ‘***’ 0.001 ‘**’ 0.01 ‘*’ 0.05 ‘.’ 0.1 ‘ ’ 1
Residual standard error: 0.644 on 7 degrees of freedom
Multiple R-squared: 0.9482, Adjusted R-squared: 0.9334
F-statistic: 64.02 on 2 and 7 DF, p-value: 3.171e-05
> plot(dtf$x, dtf$y, type = "n")
> lines(dtf$x, fitted(r1), col = "orange")
> idx <- which(dtf$d == 0)
> lines(dtf$x[idx], fitted(r2)[idx], col = "blue")
> idx <- which(dtf$d == 1)
> lines(dtf$x[idx], fitted(r2)[idx], col = "green")
> points(dtf$x, dtf$y, pch = 20, col = "black")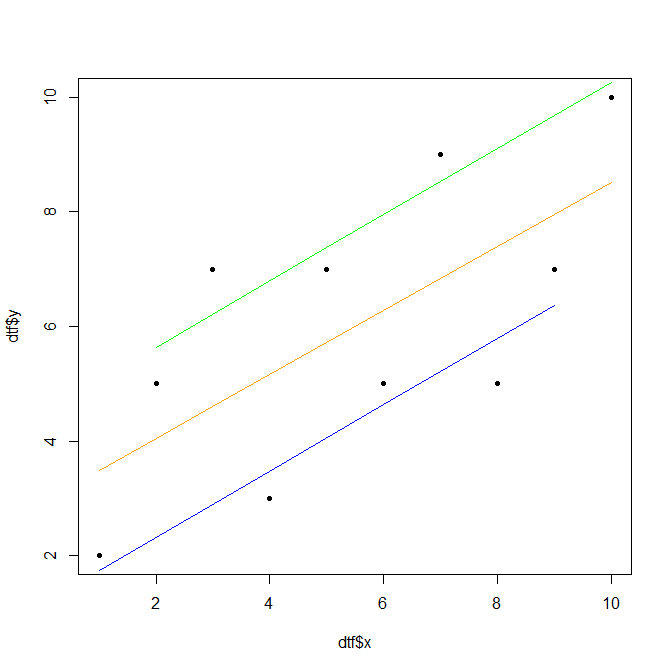
添付ファイル
